NAEP reading scores do not support a literacy crisis hypothesis
Created
Modified
Published
Introduction
This is an opinion piece in The Atlantic about an idea that is sometimes called the literacy crisis:
America Is Sliding Toward Illiteracy
Declining standards and low expectations are destroying American education.
By Idrees Kahloon
October 14, 2025
https://www.theatlantic.com/ideas/archive/2025/10/education-decline-low-expectations/684526/
Unlike other columnists that offer only anecdotes as evidence for a crisis, Kahloon points to NAEP standardized test scores from 2000-2024 as a verifiable and quantifiable measure of literacy for school children in the USA. Unfortunately, his interpretation of those test scores is definitely misleading and probably false. In fact, NAEP reading scores have been flat since the 1990s.
Let’s start here:
At the start of the century, American students registered steady improvement in math and reading. Around 2013, this progress began to stall out, and then to backslide dramatically. What exactly went wrong? The decline began well before the pandemic, so COVID-era disruptions alone cannot explain it. Smartphones and social media probably account for some of the drop. But there’s another explanation, albeit one that progressives in particular seem reluctant to countenance: a pervasive refusal to hold children to high standards.
That sounds like a significant decline in reading scores, so we’re going to see some pretty compelling evidence of this decline, right?
We are now seeing what the lost decade in American education has wrought. By some measures, American students have regressed to a level not seen in 25 years or more. Test scores from NAEP, short for the National Assessment of Educational Progress, released this year show that 33 percent of eighth graders are reading at a level that is “below basic”—meaning that they struggle to follow the order of events in a passage or to even summarize its main idea. That is the highest share of students unable to meaningfully read since 1992. Among fourth graders, 40 percent are below basic in reading, the highest share since 2000.
It sure sounds bad that 33% of 8th graders can’t summarize the main idea of a passage they just read. But the first thing we should check is whether the NAEP scores actually show a significant decline in reading test scores. Do they?
What counts as a crisis?
Before I start complaining about why I think the evidence is inadequate, I want to be explicit about what would change my mind. Here’s what I would consider good evidence for a reading crisis — or at least a serious problem — on the basis of standardized reading test scores:
A decline that is too large or too sustained to be explained by random fluctuations.
This could be a sudden acute drop or a long sustained decline. The basic problem we want to avoid is being fooled by random noise or tricks like p-hacking and cherry picking. NAEP scores are measured every two years, so say a statistically significant decrease every two years over a decade or so, e.g. five measurements totalling up to a succession of four statistically significant declines in a row. Alternatively, a decrease that is so large (e.g. by three or more standard deviations) that it couldn’t happen by chance given the number of measurements. A combination of these factors could also be concerning, for example if test scores have been steadily increasing before 2020, but the years afterward showed two major drops in succession. (Statisticians no doubt have better ways of expressing this kind of thing mathematically rather than in words.)
If such a decline can’t be explained by random error, it should also not be explicable by systematic error or confounding variables, such as major changes in testing methodology or sampling methods.
It’s possible that weak evidence from reading scores could be combined with other evidence for a reading crisis, but on the basis of test scores alone I think it’s reasonable to satisfy at least these two criteria.
How much have reading scores declined?
The NAEP provides reading scores between 1992 and 2024 for grades 4 and 8. The maximum possible score is 500. Here’s a little table of average reading scores I transcribed from the NAEP report card (re-arranged to put the years in ascending order):
| Year | Avg. 4th grade | Avg. 8th grade |
|---|---|---|
| 1992¹ | 217 | 260 |
| 1994¹ | 214 | 260 |
| 1998¹ | 217* | 264* |
| 1998 | 215 | 263* |
| 2000 | 213 | |
| 2002 | 219* | 264* |
| 2003 | 218* | 263* |
| 2005 | 219* | 262* |
| 2007 | 221* | 263* |
| 2009 | 221* | 264* |
| 2011 | 221* | 265* |
| 2013 | 222* | 268* |
| 2015 | 223* | 265* |
| 2017 | 222* | 267* |
| 2019 | 220* | 263* |
| 2022 | 217* | 260* |
| 2024 | 215 | 258 |
(Note: “Assessment was not conducted for grade 8 in 2000.”)
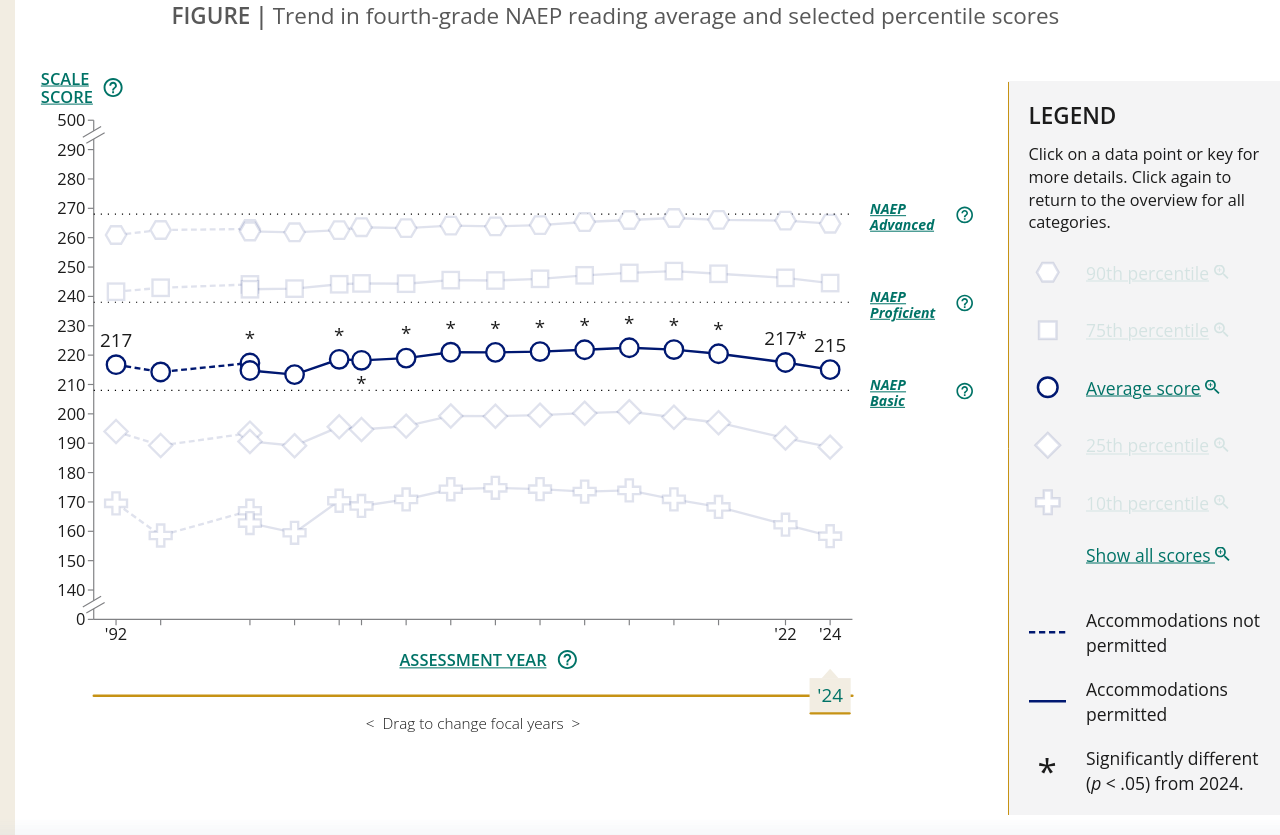
Here’s a graph of 4th grade reading scores, with average highlighted and in the background the 90th, 75th, 25th, and 10th percentiles:
And here’s the corresponding graph for 8th grade:
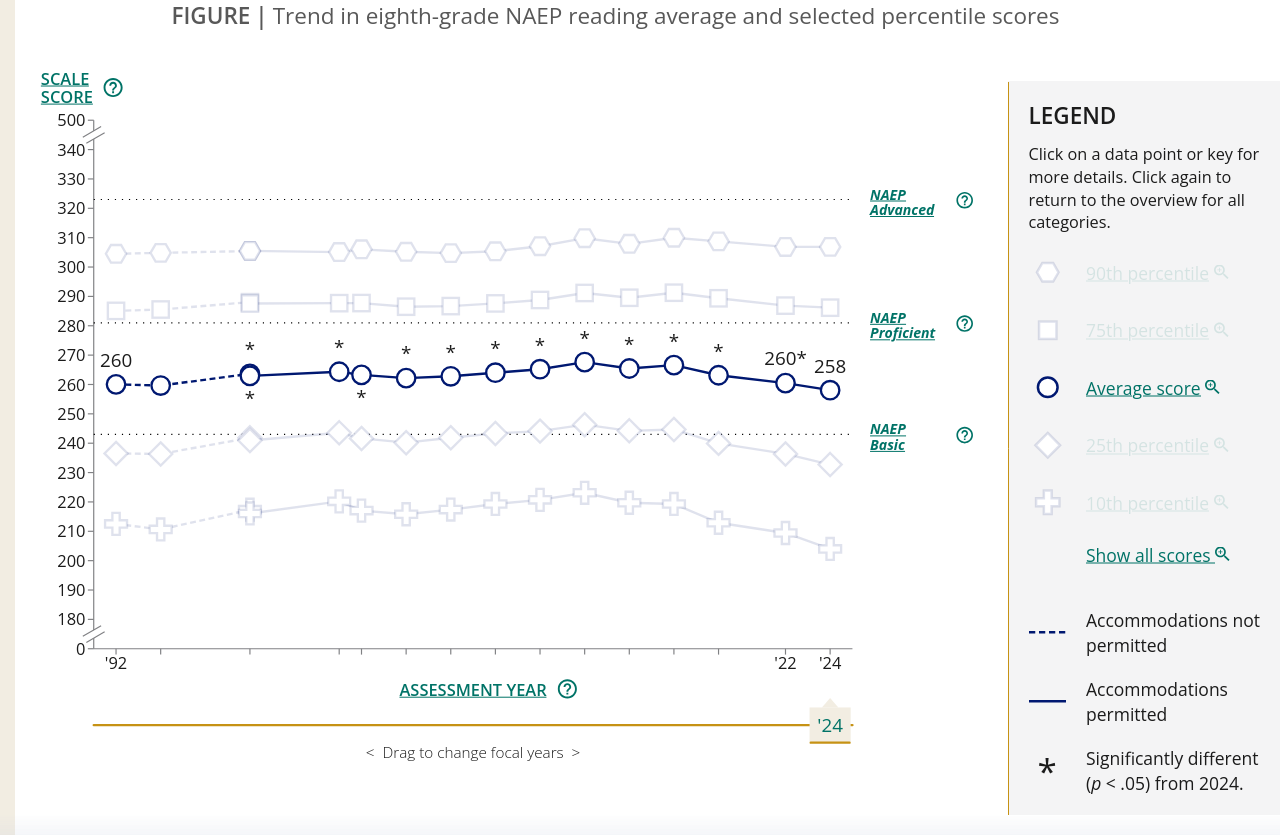
The results are… well, flat! I wish these graphs had error bars representing sampling uncertainty, but at least they put an asterisk next to points with a statistically significant difference from 2024. Notably, though, many of the differences in values compared to 2024 do not rise to the level of statistical significance:[1]
Compared to the first reading assessment in 1992, the average score was not significantly different in 2024.
https://www.nationsreportcard.gov/reports/reading/2024/g4_8/?grade=4
The peak average score for 4th graders was 223 in 2015, so a score of 215 in 2024 is an 8 point (3.6%) decrease from the peak. The peak average score for 8th graders was 268 in 2013, so a score of 258 in 2024 is an 10 point (3.7%) decrease from the peak. While statistically significant, less than 4% is simply not a big change. The overall small variation means that you could just as easily interpret these reading scores as having stayed the same or even slightly increased since the 1990s, which is hardly “sliding into illiteracy”. While these test scores don’t rule out the possibility of a literacy crisis, they certainly don’t support it.[2] Notably, fourth graders from 2024 were five to six years old in 2020, the age when most kids learn to read. I’m surprised the disruption of a global pandemic didn’t have more of a tangible impact on reading scores, it makes me think that our school system is more resilient than I had realized.
It’s not just me who thinks these scores are flat, in fact a 2018 article in The Atlantic says as much for the reading scores between 1998 and 2018:
Officially known as the National Assessment of Educational Progress, or NAEP, the data reflect the results of reading and math tests administered to a sample of students across the country. Experts generally consider the tests rigorous and highly reliable—and the scores basically stagnant.
Math scores have been flat since 2009 and reading scores since 1998, with just about a third of students performing at a level the NAEP defines as “proficient.”
— Natalie Wexler, “Why American Students Haven’t Gotten Better at Reading in 20 Years”, April 13, 2018
https://www.theatlantic.com/education/archive/2018/04/-american-students-reading/557915/
What about the long-term trends?
In addition the main NAEP scores, there’s also the LTT (long-term trend) scores that are done differently:
The NAEP long-term trend assessments in reading and mathematics, which date back to the 1970s, are distinct from the main NAEP assessments, which date back to the early 1990s. The existence of two national assessment programs—LTT and main NAEP—makes it possible to meet two major objectives: to measure student progress over an extended period of time (LTT) and to measure students’ knowledge and skills based on the most current curricula and standards (main NAEP). Results from the two assessments cannot be directly compared because they use different questions and have different levels of difficulty, and because LTT is sampled by age whereas main NAEP is sampled by grade.
https://www.nationsreportcard.gov/ltt/
The LTT reading scores go all the way back to 1971 and they… are also flat!
Here’s the average reading score for 9-year-olds:
| Year | Average score |
|---|---|
| 1971¹ | 208* |
| 2012 | 221* |
| 2020 | 220* |
| 2022 | 215 |
and here it is for 13-year-olds:
| Year | Average score |
| 1971¹ | 255 |
| 2012 | 263* |
| 2020 | 260* |
| 2023 | 256 |
This long-term study also made big changes in 2004 to provide accommodations for ESL students and students with disabilities, which is what “Original assessment format” means.
Now, these do both show a statistically significant decrease after 2020, but I don’t think this is significant in the absolute sense. But don’t take my word for it, a review article published in 2023 also describes these scores as flat:
To support her claim, she referenced a figure showing relatively flat NAEP scores followed by a slight upward trend starting around 1999 (see Figure 1). This flat trend is remarkable given the multiple reading initiatives implemented in recent decades (e.g., A Nation at Risk, 1983; simple view of reading, 1986; balanced literacy, 1990s; No Child Left Behind/National Reading Panel Report, 2001; science of reading legislation, 2013+). Despite two decades of flat and then gradually rising reading scores, balanced literacy is villainized by science of reading advocates. However, NAEP scores started leveling off at the same time science of reading legislation increased across the country (Thomas, 2022); most recently, scores dropped, assumedly due to COVID-19. While shifts in reading scores have been minimal, these changes do not suggest a reading crisis caused by balanced literacy.
[ … ]
Figure 1
Grade 4 NAEP Reading Scores and Instructional Practices
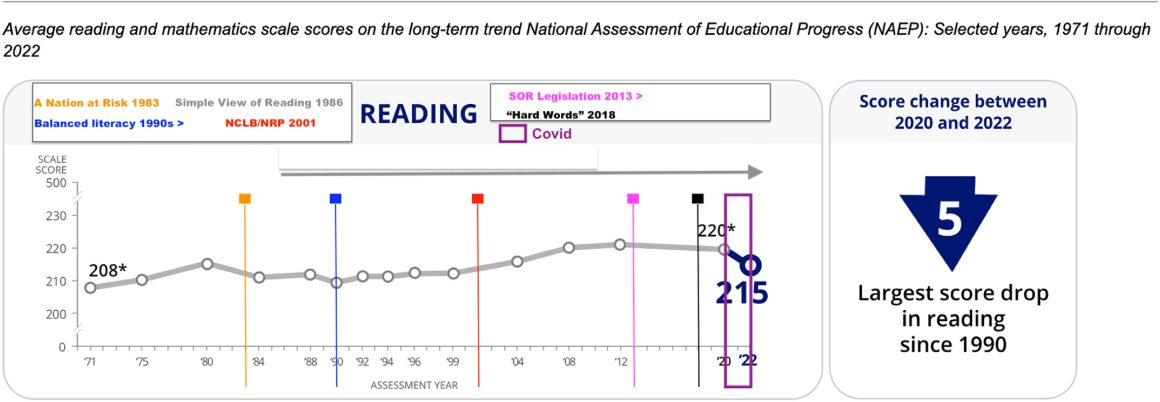
— Compton-Lilly et al., “Stories Grounded in Decades of Research: What We Truly Know about the Teaching of Reading”, November 2, 2023
https://ila.onlinelibrary.wiley.com/doi/full/10.1002/trtr.2258
This article also makes the case that NAEP scores are used to manufacture the narrative of a reading crisis:
However, NAEP scores have been the basis for a misleading and recurring story of crises for over 50 years. As Reinking et al. (2023) recently argued, “[T]here is no indisputable evidence of a national crisis in reading, and even if there were a crisis, there is no evidence that the amount of phonics in classrooms is necessarily the cause or the solution” (para 29).
https://ila.onlinelibrary.wiley.com/doi/full/10.1002/trtr.2258
While I’m sure there’s lots of interesting research being done on this, I don’t actually have an opinion on the phonics debate, so let’s go back to more fully exploring the NAEP test scores.
Is the distribution changing?
Okay, so we know that the average is about the same. But what about the distribution? For example, maybe the top 10% are doing better and the bottom 10% are doing worse, making the average about the same overall. This is basically what Kahloon argues:
Across grades and subjects, the NAEP results show that the top tenth of students are doing roughly as well as they always have, whereas those at the bottom are doing worse. From 2000 to 2007, the bottom tenth of fourth graders in reading ability showed substantial improvement, before stagnating.
https://www.theatlantic.com/ideas/archive/2025/10/education-decline-low-expectations/684526/
And indeed, the percentile tables appear to support this, where the 10th percentile (i.e. the bottom 10% of students) decreased the most (170 to 158) and the 90th percentile (i.e. the top 10% of students) increased the most (261 to 265):
Trend in fourth-grade NAEP reading average and selected percentile scores
Year 10th percentile 25th percentile Average score 75th percentile 90th percentile 1992¹ 170* 194* 217 242* 261* 2019 168* 197* 220* 248* 266* 2022 162* 192* 217* 246* 266 2024 158 189 215 245 265 Legend
* Significantly different (p < .05) from 2024. 1 Accommodations not permitted.
https://www.nationsreportcard.gov/reports/reading/2024/g4_8/?grade=4
Confounding variables
At this point we can no longer avoid talking about confounding variables and systematic errors, such as how the test is administered. And it turns out there’s a big confounding factor: ESL students and students with disabilities are taking the test much more than they did in 1992, when there were no accommodations. In fact, the test underwent a major overhaul in 2004 to address this and other factors:
In addition, since 1996, main NAEP assessments have been providing accommodations to allow more students with disabilities and students who were not fluent in English to participate. Traditionally, the long-term trend assessments have not provided such accommodations. However, in 2004, it was possible to provide accommodations and assess a greater proportion of students.
[ … ]
The revised assessment included the following changes:
- replacing outdated material;
- eliminating blocks of items for subjects no longer reported;
- replacing and reorganizing background questions;
- allowing accommodations for students who needed them; and
- changing some administrative procedures, i.e., eliminating audio-paced tapes and using assessment booklets that pertain only to a single subject.
https://nces.ed.gov/nationsreportcard/ltt/bridge_study.aspx
It seems reasonable that some or all of the decline in reading score for the bottom 10% of students could be attributed to this, since they did a comparison of the new and old test and found lower overall scores.
In particular, for 9-year-olds, 2004 results overall and for male students were lower in the revised assessment format than in the original format. This is consistent with expectations, given the increased inclusion in the revised assessment results of students with disabilities and English learners who otherwise would have been excluded from the assessment.
https://nces.ed.gov/nationsreportcard/ltt/bridge_study.aspx
I’m not an education researcher, but this is basic statistics and data interpretation, and I didn’t have to do any digging on my own: it’s explained right there on NAEP website for anyone to read! Actual education researchers agree that it’s easy to misinterpret NAEP test scores:
Understanding NAEP numbers can be tricky given that tests are not done every year and results don’t always how [sic] state data. They are also not the same as grade-level, school-based assessments, despite having the same scoring categories: basic, proficient, and advanced. This can lead to misuse of data, what one researcher in a 2013 Education Week article dubbed “misNAEPery.” And, as Professor Marty West recently wrote in an essay in Education Week, “the ‘nation’s report card’ is designed to tell us what’s happening to student achievement rather than why.”
I’m particularly confused about 12th grade. Professor Andrew Ho says there isn’t data from high school since 2019:
In earlier grades, NAEP gives us data for all 50 states and dozens of large districts, every 2-3 years. This has enabled some of our own research about pre- and post-pandemic learning and recovery at edopportunity.org (at Stanford) and educationrecoveryscorecard.org (at HGSE). But, in high school, we haven’t had NAEP data since 2019. And we haven’t had data for individual states since 2013.
But NAEP website does have reading test scores for 12th grade, and it does show a significant decline in average reading test scores, including a small decrease across the board between 2019 and 2024:
Average and selected percentile scores in NAEP reading for twelfth-grade students: Various years, 1992–2024
Year 10th percentile 25th percentile Average score 75th percentile 90th percentile 1992¹ 249* 271* 292* 315* 333 2015 233* 261* 287* 315* 337 2019 228* 258* 285* 315* 338 2024 224 255 283 313 335 Legend
* Significantly different (p < .05) from 2024. 1 Accommodations not permitted.
https://www.nationsreportcard.gov/reports/reading/2024/g12/
Unlike the 4th graders and 8th graders this is a statistically significant decline compared to 1992, but again we’re talking about a mild 9 point (3%) decline between 1992 and 2024 with average tests score going from 292 to 283, not test scores falling off a cliff.
Summary
To recap, an opinion piece by Idrees Kahloon in The Atlantic says we are “sliding toward illiteracy” because reading test scores are declining. But the test scores that Kahloon references have changed only slightly in the 32 years between 1992 and 2024, with 2024 reading scores down less than 4% from each prior peak year and down a statistically insignificant amount compared to 1992 for both 4th graders and 8th graders. Furthermore, because of changes in testing accommodations in 2004, more ESL students and students with reading disabilities are taking this test than in 1992. This change in sample population would contribute to both a decline in the average and a greater proportion of scores at lower percentiles, but for reasons unrelated to overall literacy of the student population. Simply put, the NAEP test scores do not support the idea of a crisis in student literacy.
Footnotes
| [1] | The way they calculate this statistical significance is based on sampling error, both in terms of number of students (i.e. scores come from a small subset of the whole population) and number of questions (i.e. assessing a student’s literacy from about 21 questions). There’s a detailed breakdown of the survey design here: For example, 8th-grade students being assessed in reading are presented with, on average, 21 of the 110 assessment items. https://nces.ed.gov/statprog/handbook/naep_surveydesign.asp There’s also a good discussion of data quality and comparability, which covers other sources of uncertainty that aren’t covered by sampling error, such as non-response error, which results in many private schools being excluded from the results: Standards established by the National Assessment Governing Board require that school participation rates for the original state/jurisdiction samples need to be at least 85 percent for results to be reported. In 2015, all 52 states and jurisdictions met this participation rate requirement with participation rates of 93 to 100 percent. Before substituting new schools for originally sampled schools that declined to participate, the weighted national school participation rates for the 2015 reading and mathematics assessments were 97 percent for grade 4 (100 percent for public schools, 61 percent for private schools, and 83 percent for Catholic schools), and 96 percent for grade 8 (99 percent for public schools, 56 percent for private schools, and 80 percent for Catholic schools). In 2015, the school participation rates for private schools at both grades 4 and 8 did not meet the criteria so their results are not reportable. |
| [2] | For example, Rose Horowitz, also in The Atlantic argues that the real literacy crisis is in sustained reading, i.e. entire books:
— “The Elite College Students Who Can’t Read Books”, October 1, 2024 She argues that emphasis on standardized tests like the NAEP is partly at fault for this, since these necessarily test short passages instead of entire novels. This is intriguing but I’m not aware of any actual evidence for it. |